The Nonpartisan Leader Newspaper, July 11, 1921, Page 5
You have reached the hourly page view limit. Unlock higher limit to our entire archive!
Subscribers enjoy higher page view limit, downloads, and exclusive features.
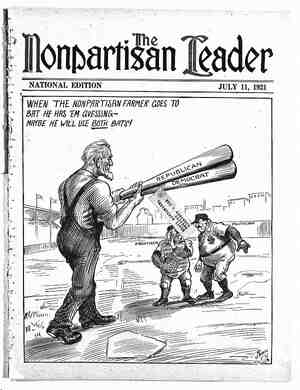
Elevators Lose Millions by Gambling Startling Figures Disclosed by the Federal Trade Commission in Report on Elevator Profits—Does Hedging Protect Against Fluctuations? mem | HE federal trade commis- patronage dividends: 1915-16, 3.78 1| sion has just published __OPERATING RESULTS cents per bushel; 1916-17, 6.62 cents per the result of an investi- sean Al BLEVATOR ggg l;%];g‘:gll 0 S bushel; 1919-20: 8.45 cel;ts per bushel. gation of the operations 5 ; : Co-operatives not paying patron- of terminal elevators Year ending June 301 1913 1914 1915 1916 1917 1920 age dividends: 1915-16, 2.22 cents per since 1913, excluding Gross profit on grain sold, bushel; 1916-17, 4.23 cents per bushel; 1919-20, 5.77 cents per bushel. HANDLING CHARGES FOR 1920 ARE SHOWN The report also covers, by states, the operations of non-line elevators for the 1919-20 crop year. The figures are the general averages. The average gross profit per bushel, excluding hedging gains or losses, that is, the excluding hedges ..... $.0256 $.0194 Hedge gain or loss...... 0041 .0069 Gross profit on grain sold, including hedges ..... .0298 Elevator operating ex- $.1044 $.0293 $.2012 $.1273 1918 and 1919, when the future mar- *0396 *.0039 *.1396 *.0528 ket on grain was closed, but including — the year 1920. The figures thus give the pre-war profits and cost per bushel of handling grain, as well as the post- war figures, showing that profits and cost of handling per bushel have doubled. But the most remarkable thing the report shows is that terminal eleva- tors, in their sp-called “hedging” 0263 .0648 .0254 0616 0745 0075 0100 .0075 0141 .0203 .0070 - Elevator operating profit before deducting gen- eral, administrative and selling expenses. 0228 .0188 .0548 .0179 .04756 .0542 operations—that is, trading in futures with the supposed idea of protecting themselves from losses on account of fluctuations in the market—lose mil- lions of dollars, which comes mostly out of the farmers’ pockets and to some extent out of the consumers’. - Thus, 10 terminal elevators taken by the trade commission as typical, showed a net loss on six years’ business of $10,640,293.82, as a result of “hedging.” That is, these elevators dur- ing these years would have saved an average of over $1,000,000 a year each if they had not hedged at all. (See small table on this page.) The 10 elevators chosen for the test were located as follows: Six in Minneapolis, two in Duluth and two in St. Louis and Kansas City. The com- mission’s table on loss“and gain, shown on this prage, shows that these elevators made' a:profit of over $800,000 during 1918 and 1914 in their hedging - operations, but that for the other four years report- I ed they lost a total of $11,440,506.63, so that their net loss on the six years’ operations from hedging was over ten and one-half million dollars! Is the claim of the grain trade that hedging is insurance against loss a valid claim in the face of these figures? GRAIN GAMBLERS HARVESTED GREAT CROP OF DOLLARS In one year (1917) these 10 terminal elevators lost over $6,000,000 through hedging. Last year their loss was over $2,000,000. On the other hand, the profit on their investments. that these elevators earned did not fall off during years when these great losses on gambling on the future market took place. In fact, the profits increased in years when WHO STOOD THE LOSS? Ten terminal elevators. " Gain by hedging $306,754.36 493,458.45 Loss by hedging $2,849,804.62 286,654.82 6,279,860.85 2,024,186.34 $800,212.81 $11,440,506.63 Net loss on 6 years’ hedging. 10,640,293.82 the gambling losses occurred. Who, then, paid this huge gambling loss? Who won the bets and is $10,000,000 ahead? It is certain from the figures that the elevators did not lose—they charged enough for handling grain so that they kept up their profits and were able to pay. the gambling losses at the same time. It is likewise certain that those who won on this tremendous speculation in futures were the gamblers of the grain exchanges. Who but the farmers and the consumers had to make up the loss? The other table we print shows how these same 10 terminal elevators are profiteering. Note that in 1913 the gross profit per bushel for handling grain, excluding hedging operation gains and losses, was only a little over 2% cents a bushel, while it was less than 2 cents in 1914, This was before the war. Then came the wave of war profiteering. gy Co-operatives paying a *LOSS NOTE—General administrative, selling expenses, etc., are so com- bined with expenses applicable to other income that they can not be shown for grain alone and hence no net profit per bushel of grain can be shown. Note that in 1915 the figures were over 10 cents a bushel. In 1916 the profits were normal, but in 1917 the gross profit had soared to over 20 cents a bushel. Last year the profit was nearly 13 cents a bushel, five to six times the pre-war profit per bushel. Farmers ought to be in the terminal elevator business, instead of breaking their backs for slight or no returns producing grain. The money is in the handling instead of the producing end, under our upside-down economic system. i The report also shows “the per cent of income to invested capital” of the 10 elevator companies for the years mentioned. This is the profit on invest- ment, and it was as follows: 1918, 25.20 per cent; 1914, 14.95 per cent; 1915, 41.68 per cent; 1916, 17.63 per cent; 1917, 22.76 per cent; 1920, 22.24 per cent. ‘What per cent did l you, as a farmer, make on your invested cap- ital during these years, after you had charged off wages for yourself and family and all other legitimate expenses? The report also cov- ers country elevators in 14 states. The coun- try elevators are divid- ed into the following classes: “Non-line” country elevators, which include “independent” eleva- tors not paying patron- age dividends.” The other classification is “line” - elevators. The line elevators make the highest charge for -handling grain, the report says. Under the heading, “Gross profit, excluding hedges,” the commis- sion gives the handling charges per bushel of grain. The figures are as follows: Line elevators: 1915- 16, 4.16 cents per bushel; 1916-17, 13.51 cents per bushel; 1919- 20, 13.80 cents per bushel. ; Independent eleva- tors: 1915-16, 3.66 cents per bushel; 1916- 17, b5.72 cents per bushel; 1919-20, - 6.61 cents per bushel. PAGE FIVE b handling charge per bushel, for 1919- 20 is 6.97 cents. By states the hand- ling charge per bushel for these non- line country elevators is as follows: Minnesota 7.10 cents; North Dako- ta, 11.02 cents; South Dakota, 8.29 cents; Montana, 15.59 cents; Nebras- ka, 7.85 cents; Kansas, 10.97 cents; Missouri, 9.75 cents; Oklahoma, 11.93 cents; Illinois, 4.12 cents; Iowa, 3.55 cents; Wiscon- sin, 8.06 cents; Michigan, 14.28 cents; Indiana, 5.41 cents; Ohio, 5.60 cents. When shown the commission’s figures on tremen- dous losses due to hedging Twin Cities elevator men said the losses were only “apparent” and not actual. That is, they claimed the item, “hedge losses,” re- ported by the commission did not represent the com- plete transaction. They said that, when the actual grain was sold, after the future deal was closed out, the lossgs through the deals in futures were wiped out. But the Leader wrote the federal trade commission and has on file its answer, which main- tains the losses were ACTUAL and not mere' “apparent” hedging losses—that if the elevators had NOT hedged, they would have been ahead th amounts they are shown to have lost. SOME PRUNING NEEDED 3 . —Drawn expressly for the Leader by W. C. Morris. The farm product market tree needs pruning all right! Read the figures on 10 terminal elevators on this page, as published by the federal trade commission.